
As a marketing professional for hire, you need to be able to show your worth to the client. Obviously, the best way to do that is to show a link between your marketing efforts and increased revenue for the client. Unfortunately, that’s not always possible–especially in the very early stages of working together.
Most clients understand that getting results takes time, but even so, having actual numbers to point at and show that your work is getting some kind of results can boost your client retention rates. So, what are those numbers and how do you get them?

Photo Credit: mueritz via Compfight cc
The metrics that matter: impress your clients with these
In general, spend your time and effort pulling together results-oriented metrics, not vanity metrics. Some clients do like to see that their Facebook likes or post reach, or Twitter followers, are going up. And those data points take so little time to pull them together that you should be sending them to your clients, no matter what.
But Facebook likes don’t make a business, so don’t rely on vanity metrics when it comes to impressing your clients. Instead, here are a few other places to draw numbers from:
Conversion rates
You should be tracking conversion rates for both purchases and email list sign-ups. Even if you aren’t pulling in a huge revenue increase yet, if you can show the client that conversion rates are increasing over time, that points to your efforts having worth. You can also tell them what your team is learning from the conversion rates and how you’re adjusting your marketing strategy based on that knowledge. A little reassuring information goes a long way to making a client feel like you’re doing something with their money and that you’re working hard to improve their business.
If you’re using an A/B testing tool, it’ll report the conversion rates for each version of the page to you. If you’re not, you can set up goals in Google Analytics for non-commerce related goals, or e-commerce tracking for purchases.
Open rates and click-through rates for email
After all, it doesn’t do any good if you’re collecting email addresses and sending out newsletters if nobody opens them or reads them, right? Every time you send out an email campaign, keep a close eye on the open rates and click-through rates. Make note of what send times generate the best response, and any open patterns. For example, maybe people tend to not open emails until two days after you send it. You could send emails around the days and times that people tend to open them and see if there’s always a two-day delay, or if that other day/time just works better for your subscribers.
You could argue that open rates and click-through rates are vanity metrics of a sort. And it’s true that someone opening an email doesn’t make them a customer. However, increasing email engagement widens the top of your funnel, creating more engaged prospects for you to turn to customers later. Email is also a great way to keep current customers engaged and retain them–more on why that’s so important in a second.
You can easily find open rates and click-through rates in your email marketing tool’s reporting options. Make sure to track the open rates and CTR over time, too. That way, you can (hopefully!) show the client that they’re trending upwards as you and your team work on more emails and more marketing campaigns.
Lifetime customer value and retention rates
These metrics take much longer to acquire than the others, but they’re still worth looking at. All too often, gaining new customers comes at the expense of retaining existing customers This is a huge mistake, as getting a new customer costs, on average, 5x more than retaining a current customer. If you can show the customers that your content and social media marketing efforts are keeping customers around and engaged, and creating more repeat customers, then you’re golden. This is typically available in more advanced analytics tools, but you can calculate it manually if need be, as long as you have access to the data.
Having said all of that, these specific metrics aren’t always as important as experimenting with your efforts. For example, tracking the results of Facebook campaigns vs. Twitter campaigns, or trying out different types of posts (image posts, conversational posts, funny memes) on a certain platform and seeing what actually gets results. This lets you actually back up suggestions to the client. Instead of just saying, “We’d like to focus more on Twitter and less on Facebook,” you can say, “Our tracking efforts have shown that people coming from Twitter are 5x more likely to convert to a customer, so we’d like to focus more of our efforts there.”
One way to gather that kind of data is by tagging links with different UTM parameters for different platforms; this adds an extra layer of data to your reporting that can provide more information on how people from certain sites behave. (And of course, Terminus can help you with that!)
Three tools to create gorgeous charts of your marketing metrics
All right, you’ve got your metrics to impress your client; what’s next? A great chart to show them off, of course. Here are a few options to make it with:
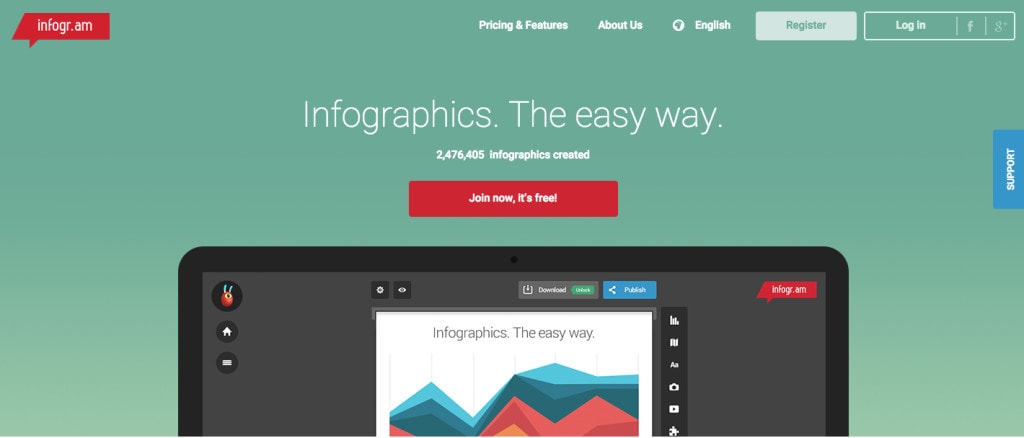
Infogr.am
Infogram creates visually appealing charts that you can export as an image or embed on a webpage. You can import data via CSV, XLS, or XLSX files, or pull in live data from a Google spreadsheet. Plans start at $18/mo.
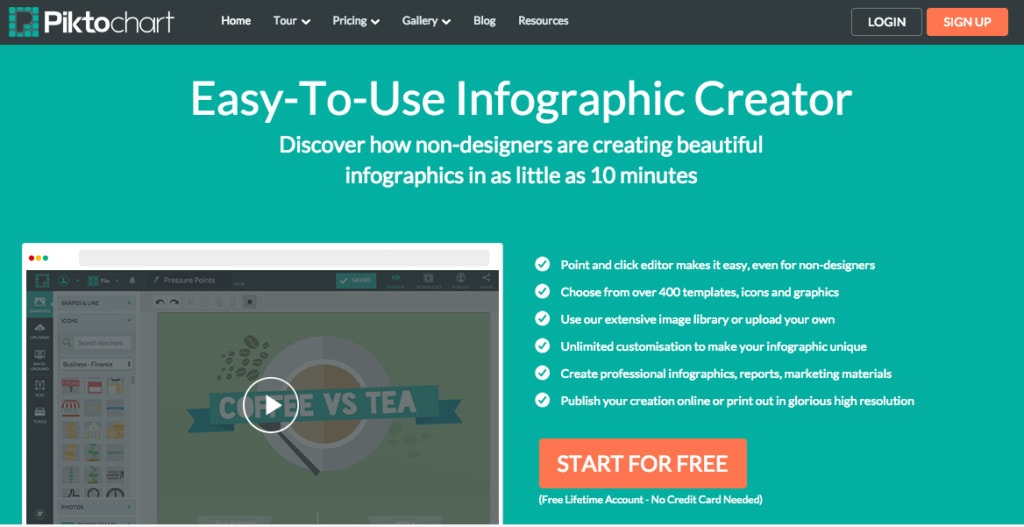
Piktochart
Piktochart’s focus is more infographic specific than just showcasing data, and its import options are limited, but it could still work for reporting purposes. They also try to make the process as quick as possible, with ready to go templates to kickstart your graphics. Standard plans are free with the Pro plan costing $29/month.
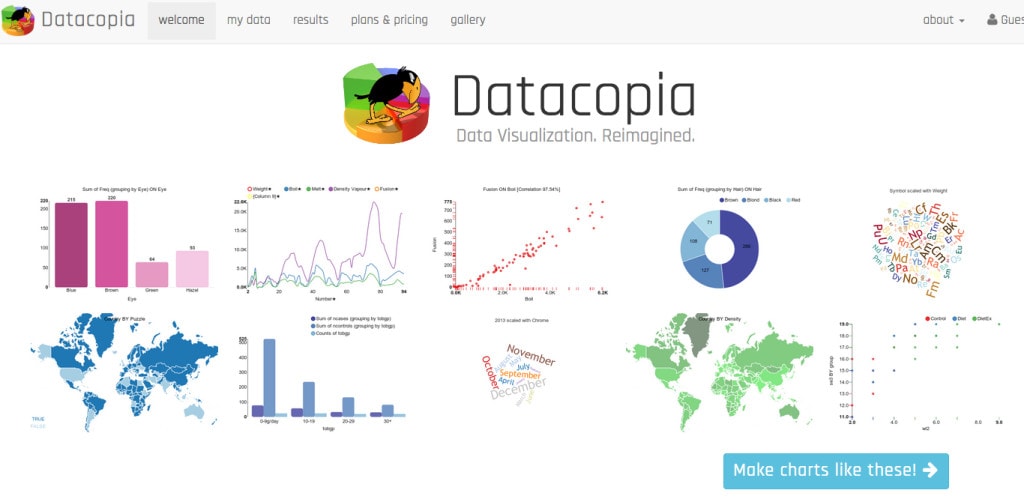
Datacopia
Where Piktochart is more infographics oriented, Datacopia’s focus is purely on creating beautiful graphs. If you want to create a straight-up graph, but still make it look good, this could be the way to go, and at about $9/mo for the pro plan, it won’t break your bank.