Published by Terminus, the marketing taxonomy governance platform.
3 Lies Google Analytics Likes to Tell (And How to Fix Them)
Last updated

The new site design is beautiful.
Contemporary. Flat. Etc.
Eagerly, you hop over to Google Analytics to see how it’s performing. How many new daily visitors have checked out your site in the last few hours.
You open it up and you’re delighted in what you see. Hundreds of views over the past 24 hours alone!
Except, here’s the thing…
What you’re seeing is a mirage. It’s technically happened. But not really.
Fortunately, you can solve this problem. But the trick is that you have to know exactly where to look first.
Continue reading to learn the three white lies Google Analytics are telling you and how to fix them!
Lie #1. Dark Traffic
Direct traffic is a red herring. Sure it looks legit. Some of it even is (unlike spam bot referrals… which we’ll save for another day). But otherwise, it’s incredibly misleading.
“Dark traffic” is the ominous nickname commonly given to social traffic that flies under the radar.
Instead of showing up under Referrals or Social in Google Analytics, it gets lumped under direct. And as we’ve discussed, direct traffic tends to be like your junk drawer at home.
For example, Google Chrome now forces websites to use SSL certificates. So webmasters are setting up redirects to make sure the HTTP version of their site transfers users over to HTTPS (to avoid the warning notifications).
This is an issue because redirects like that often strip away the referral source data. 302 redirects and those from desktop apps (like Outlook, etc.) are also common culprits.
Here’s another example of a plausible issue: Tons of direct visits from your internal team. Marketers, designers, and developers who might be testing your site or putting on the finishing touches before it goes live.
These visits also commonly show up as Direct and give you the impression that your site is much more popular (than it might be).
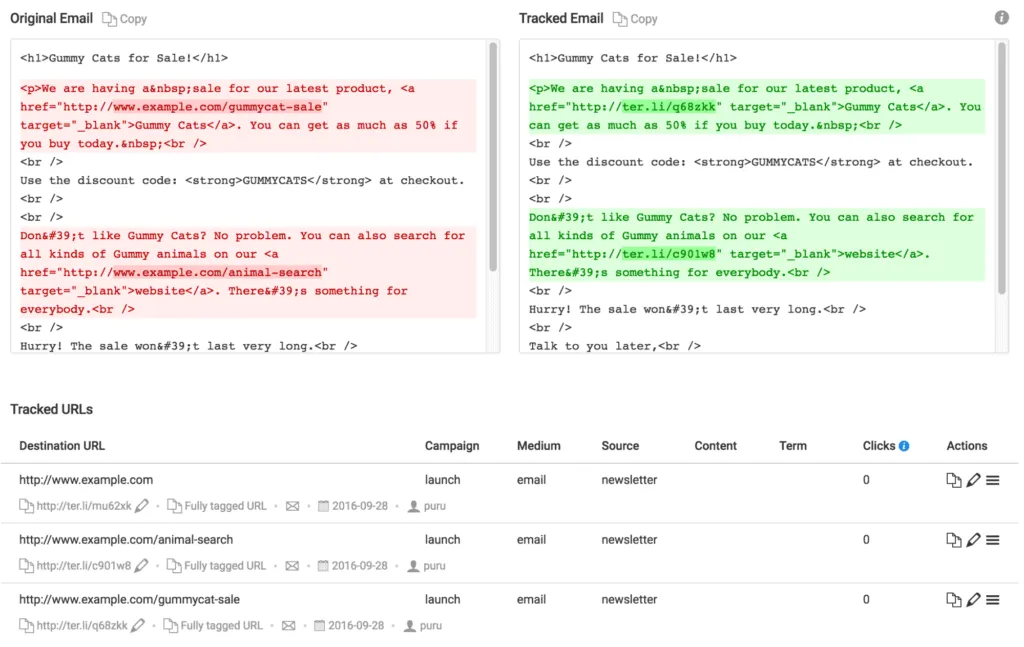
Solution #1
Tag as many referral links as possible.
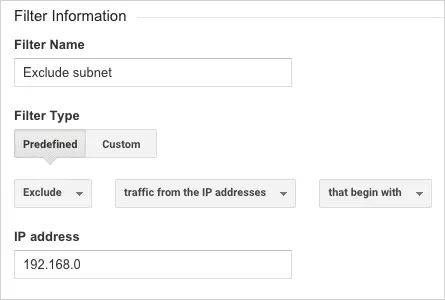
Solution #2
Start by obtaining and blocking the IP addresses for your office network, remote workers, and outsourced vendors.
Solution #3
Create a new segment for people that come through ‘Direct’ but instead of coming through the homepage, go straight to a content piece. These typically have too-long-too-remember URLs. This means the chances of someone actually typing those suckers into their address bar are slim to none.
Lie #2. Last Touch + Macro Goal Bias
Google Analytics is good at telling you certain things.
For example, what devices or browsers people are using to visit your site. Where people are coming from (in aggregate). And how many of those people accomplish certain ‘macro’ goals on your site.
These goals typically include ‘hard’ conversions like email submissions, quote form opt-ins, and product purchases.
The problem here is twofold:
- You often can’t tell which individual users do what.
- And you often can’t see all of the steps that an individual takes prior to converting.
Technically, you can instrument Google Analytics to show sophisticated attribution modeling with user session IDs, etc. But that’s rarely (if ever) done correctly. It’s tough if you’re not experienced. (And it might be faster/easier/cheaper to simply layer on another analytics tool like Kissmetrics, Mixpanel, or a fully-featured CRM.)
The second issue though is the tough one. If you have a product or service that’s remotely expensive, you won’t see all of the subsequent visits and ‘micro-commitments’ people take prior to purchase. (So you won’t know how to tweak, fix, iterate, and improve on those either.)
Solution #1
Starts with the basic User Flow report. This report is far from perfect. But it gives you an easy starting point to see how people come into your site and interact with certain pages.
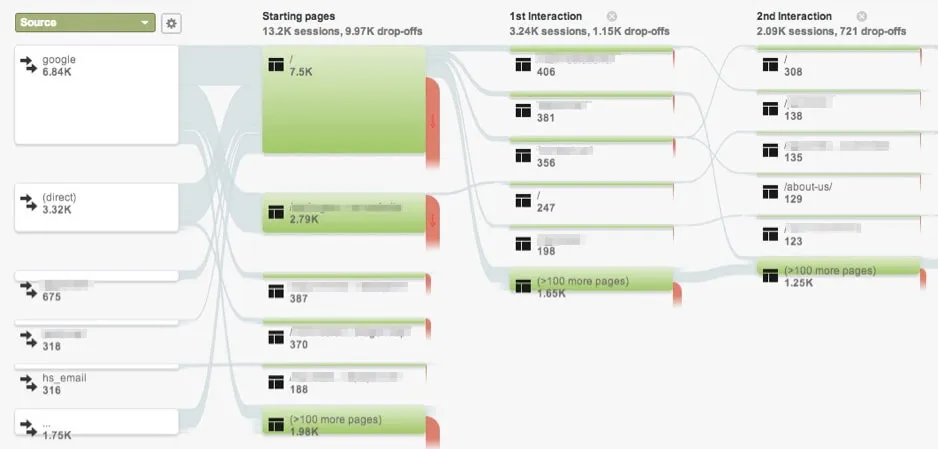
Now you can visualize how ‘cold’ traffic is discovering your blog posts and building trust by looking at product tour pages before taking the final ‘hard’ step that you can track.
Solution #2
For product companies is the Shopping Behavior report (under Shopping Analysis). This will provide more granular data with sessions broken out by product views, added to cart, etc.
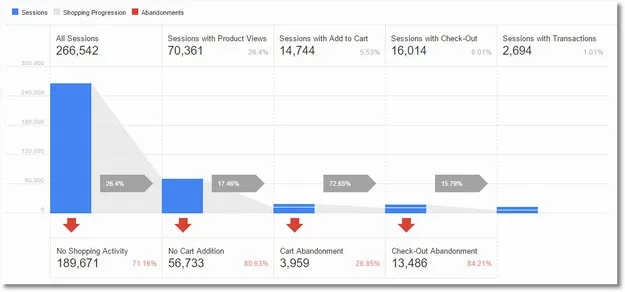
Analyzing your website’s ‘user flow’, similar to this extended eCommerce experience, can help any company isolate the gaps or bottlenecks in their conversion funnel that are detracting from end results.
Lie #3. Aggregate Averages
What’s a ‘good’ bounce rate?
Conventional wisdom says higher is worse and lower is better. Right?
Well yes. But not always.
Let’s use an opt-in form landing page as an example. The goal of said page is to generate new leads. People visit the page, type in their name and email, and get sent to a Thank You confirmation page.
The trouble comes in various forms. If you’re sending ‘warm’, qualified traffic to this page, you should see pretty high conversions. Which means you also might see a high bounce rate. Technically speaking, people are hitting one page and converting quickly.
That means other basic engagement metrics, like time on the site, are going to be artificially skewed, too.
The point?
Only looking at surface level data like site-wide averages can be misleading.
Solution #1
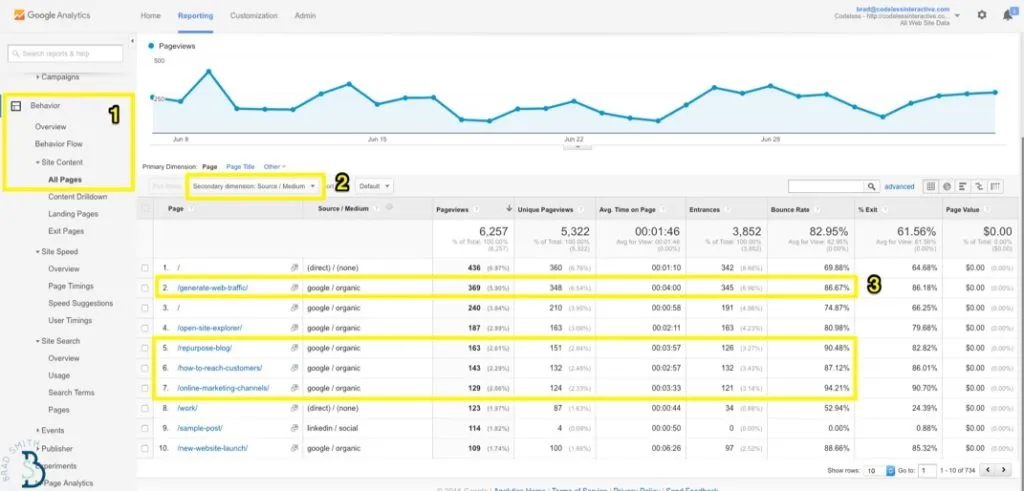
Dive deeper into individual pages.
For example, take a look at the most popular content on your site right now (under Behavior > Site Content). Chances are, you’ll notice that most people are reading blog posts from six to twelve months old.
The next thing you’ll notice is how high bounce rate is for those blog posts. Ouch!
If you have posts that are receiving a ton of pageviews but a high bounce and/or exit rate, that’s bad! Time for an update, refresh, redesign, etc.
This also brings us to the second quick fix.
Solution #2
Layer over the traffic source data as well. Blog posts might perform differently depending on if it’s ‘cold’ traffic from Organic Search vs. ‘warm’ from Email.
Blog posts often fall victim to ‘dark traffic’ (see #1), but landing pages can be saved with inbound traffic segmentation.
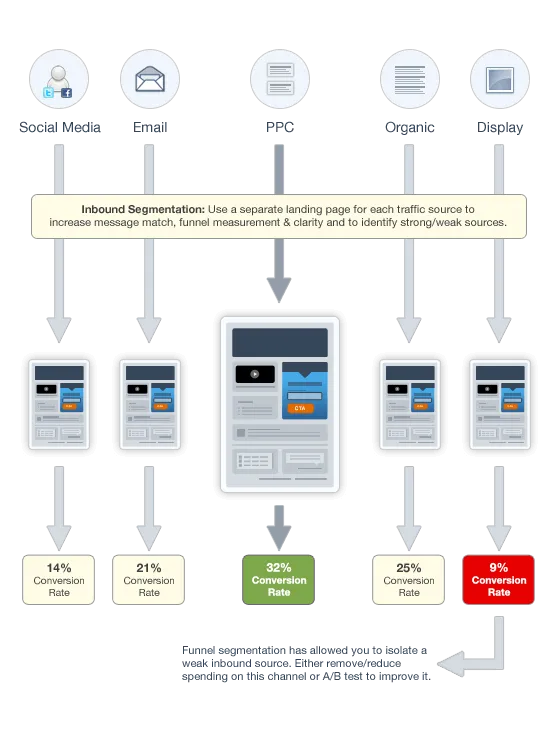
It takes some extra work. A little more elbow grease.
Duplicating landing pages, making subtle tweaks for the new audience segment, tagging campaign links to these pages, and last but not least, noindexing duplicate content variations you don’t want to rank or show up in Google.
But the end result is that Google Analytics will have no other choice but to give you more accurate data.
Conclusion
Analytics isn’t about collecting raw data.
Sure, that’s the input. But the purpose of analytics is to translate raw statistics into insightful findings.
They should ideally act like a spotlight: shining a light onto new areas for improvement or places where you’re currently going wrong.
The trick is to understand where those dark places exist and figuring out how to shed light on them.
- 3 Users
- 5 Projects
- 2 Custom Domains
- Simple Taxonomy
- UTM Rules
- Presets
- Labels
- Notes
- Custom Parameters
- Multi-tag UTM Builder
- Auto-shortening
- Click Reports
- Fine-grained User Permissions
- Auditing Tools
- Chrome Extension
- Custom Domain SSL
- URL Monitoring
- Redirect Codes / Link Retargeting
- Bulk Operations
- 5 Users
- 10 Projects
- 3 Custom Domains
- All Taxonomy Types
- Bulk URL Cloning
- QR Codes
- Conventions
- Grid Mode URL Builder
- Email Builder
- Auto-generated Tracking IDs
- Automated Exports
- API Access
- Custom Users
- Custom Projects
- Custom Domains
- Single Sign-On (SSO)
- Invoice Billing
- Signed Agreement
- SOC 2 Type 2