Published by Terminus, the marketing taxonomy governance platform.
Email Marketing Benchmarks: A Comprehensive Guide
Last updated

How to set, track, and understand your email marketing metrics
As any modern marketer knows, email marketing is a vital component to successful and well-rounded digital campaigns. Not only is email one of the most widely-used methods of communication worldwide (there are roughly 3.9 billion active email users globally), it’s also a highly effective and measurable tactic marketers can leverage to connect with their audiences.
Why Is Email Marketing Important?
Email marketing allows the sender to obtain key marketing metrics through email link click tracking. Understanding the metrics obtained from tracking emails, such as click rates, unsubscribe rates, and delivery rates provides insight into your campaign’s performance. That information is important because it allows you to analyze and readjust your campaign strategy where needed.
What’s more, email is a direct and personalized method of communication with your consumer base. Sending relevant, timely, and insightful content in your emails allows you to establish trust and credibility for your brand within your audience, which pays off in the long run. According to a 2019 HubSpot study, consumers overwhelmingly prefer connecting with brands via email, and the proof is in the pudding: email continues to boast a remarkable ROI, at $42 earned for every $1 spent. What’s more, email is reported to be 40 times more effective at acquiring new customers than either Facebook or Twitter. Today, email is one of the most cost-effective and conversion-rich components of digital marketing strategies, and it’s looking like that trend will continue. By 2023, we’re expecting to see a total of 4.4 billion active email users worldwide, indicating a huge opportunity for email marketers.
That said, marketers reap the benefits of emails only when they track and properly leverage their email metrics.
Why Keep Track Of Email Benchmarks?
Marketers need a clear picture of how their emails are performing in order to run successful campaigns. If you’re not measuring your data correctly, you won’t know where your email marketing strategy stacks up in comparison to others in your industry — or how your performance changes over time. It’s important to keep track of your metrics and understand the industry benchmarks to boost your campaign’s effectiveness and reach your marketing goals.
To properly understand your email benchmarks, you’ll need to get comfortable with email tracking. In a nutshell, email tracking provides detailed insight into when your emails and links in emails are clicked on, giving you an idea of how your emails are performing among your subscribers.
In this article, we’ll discuss what kind of email metrics you should be tracking to keep your campaigns healthy, and how to best do that using UTM parameters and Google Analytics. We’ll also walk you through the different industry email industry benchmarks (or, industry averages) so you can better understand how your email campaigns compare to your industry standard.
What Benchmarks Should You Be Tracking?
First, let’s take a look at the benchmarks you should be monitoring in your campaigns.
Average Open Rate
A good email open rate averages around 17.8% across all industries (keep reading to find out your specific industry’s benchmark). So what if your average open rate is lower than that?
A low open rate could be an indicator of a few different issues. It could, for example, mean that your subject lines need a tune-up. Compelling subject lines should be short, sweet, and personalized. They should also be tailored to the specific person you’re trying to reach. Steer clear from using all caps and exclamation points — you’ll run the risk of looking like spam.
How else to pinpoint why your open rate is sub-average? Review your email recipient list. You could be targeting the incorrect audience or sending messages to emails that no longer exist. You should also check your risk for having been placed on a spam list. There are free online resources that will help you determine whether or not your email has been blacklisted.
Average Click-Through Rate
Your click-through rate is the percentage of people who click on at least one link in your email. It’s calculated by dividing the number of people who have clicked on your email by the number of emails you have sent. Across all industries, the average click-through rate is 2.6%.
A good place to start troubleshooting if you’re suffering from low click-through rates is with your CTAs (calls to action). When it comes to CTAs, placement is key: according to a 2018 Journal of Marketing Communications study, links placed in the top left of an email newsletter have a higher impact than those placed in the top right. Our eyes naturally start there when reading and make their way down the page in a Z-pattern.
Additionally, be sure you’re not bombarding your subscribers by placing too many CTAs in one email. The golden rule here is the fewer, the better.
As always, personalizing your CTAs will help drive higher click-through rates as well.
Average Click-to-Open Rate
The average click-to-open rate indicates, of all the people who opened your email, what percent found the content inside valuable or relevant enough to click on. It’s calculated by finding the click-through rate and dividing it by the number of emails that were opened. Across industries, the average click to open rate is 14.3%.
Again, re-evaluate your CTAs if your average click-to-open rate is low. You might also check to make sure your emails are well-designed and digestible for busy readers. Using dynamic content will help with this. It will also help to double-check your emails are hitting the right target audience, as your click-to-open rate is a good indicator of how interesting your content is to your subscribers.
Average Unsubscribe Rate
The most dreaded metric of all might just be the average unsubscribe rate. Regardless of how uncomfortable it is to know who’s opting out of your email communications, this is an important benchmark to track. Understanding who unsubscribes from your emails will help you adjust your messaging tactics to keep your audience engaged in the future.
If you’ve noticed a high unsubscribe rate for your emails, there are a few factors that may be at play. The first is your subject line. Again, make sure it’s short, compelling, and personalized.
The second is the frequency with which you send your emails. Of course, how many times you send an email per month, week, or day will vary by industry and campaign strategy. However, be sure that you’re not overloading your subscribers with messages.
Lastly, be sure that you’re sending relevant content to the right audience.
Average Bounce Rate
An email bounce rate is the percentage of subscribers in your email list that didn’t receive your message because it was turned away by the intended recipient’s email server. You might be getting hard bounces, which refers to emails that bounced back to the sender without ever being accepted to the recipient’s mail server. Or you’ll run into soft bounces, which is when an email that’s been accepted by the server bounces back undelivered anyway.
Thoroughly double-checking your emails before sending is a good start to lowering a high bounce rate; you want to ensure that your emails don’t look like spam and that you’re sending them to the right audience. It’s also a good idea to comb through your contact list and delete any email addresses that are invalid.
Benchmarks By Industry*
Now that you’re aware of the types of benchmarks you should be tracking, it’s time to measure how your stats compare to your industry’s averages.
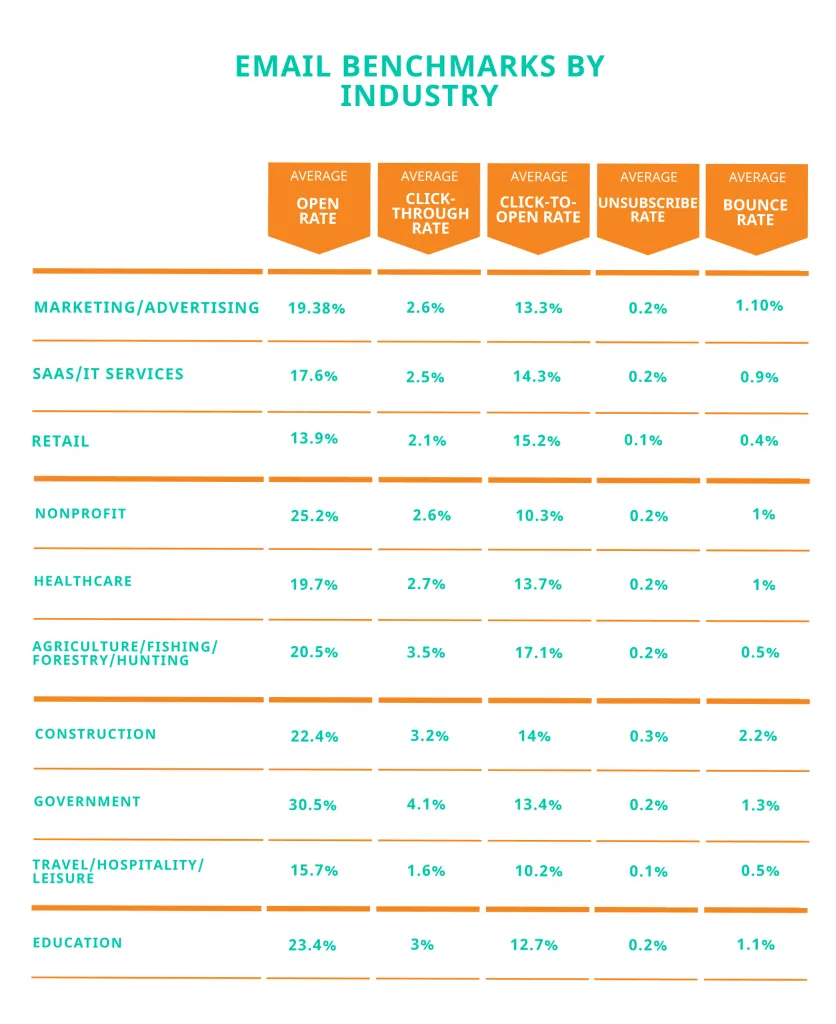
Marketing and Advertising
- Average Open Rate: 19.38%
- Average Click Rate: 2.6%
- Average Click-To-Open Rate: 13.3%
- Average Unsubscribe Rate: 0.2%
- Average Bounce Rate: 1.10%
SAAS and IT Services
- Average Open Rate: 17.6%
- Average Click Rate: 2.5%
- Average Click-To-Open Rate: 14.3%
- Average Unsubscribe Rate: 0.2%
- Average Bounce Rate: 0.9%
Retail
- Average Open Rate: 13.9%
- Average Click Rate: 2.1%
- Average Click-To-Open Rate: 15.2%
- Average Unsubscribe Rate: 0.1%
- Average Bounce Rate: 0.4%
Nonprofit
- Average Open Rate: 25.2%
- Average Click Rate: 2.6%
- Average Click-To-Open Rate: 10.3%
- Average Unsubscribe Rate: 0.2%
- Average Bounce Rate: 1%
Healthcare
- Average Open Rate: 19.7%
- Average Click Rate: 2.7%
- Average Click-To-Open Rate: 13.7%
- Average Unsubscribe Rate: 0.2%
- Average Bounce Rate: 1%
Agriculture, Fishing, Forestry, and Hunting
- Average Open Rate: 20.5%
- Average Click Rate: 3.5%
- Average Click-To-Open Rate: 17.1%
- Average Unsubscribe Rate: 0.2%
- Average Bounce Rate: 0.5%
Construction
- Average Open Rate: 22.4%
- Average Click Rate: 3.2%
- Average Click-To-Open Rate: 14%
- Average Unsubscribe Rate: 0.3%
- Average Bounce Rate: 2.2%
Government
- Average Open Rate: 30.5%
- Average Click Rate: 4.1%
- Average Click-To-Open Rate: 13.4%
- Average Unsubscribe Rate: 0.2%
- Average Bounce Rate: 1.3%
Travel, Hospitality, and Leisure
- Average Open Rate: 15.7%
- Average Click Rate: 1.6%
- Average Click-To-Open Rate: 10.2%
- Average Unsubscribe Rate: 0.1%
- Average Bounce Rate: 0.5%
Education
- Average Open Rate: 23.4%
- Average Click Rate: 3%
- Average Click-To-Open Rate: 12.7%
- Average Unsubscribe Rate: 0.2%
- Average Bounce Rate: 1.1%
*Source: Campaign Monitor’s Ultimate Email Marketing Benchmarks for 2020: By Industry and Day
For more industry benchmarks, check out the studies below:
How Do I Track My Email Benchmarks?
Now you know which email benchmarks you should be tracking and where your averages should land in comparison to your industry counterparts. The next step is learning how to track these benchmarks so you can build better-performing email campaigns.
The Terminus app makes tracking emails simple with a UTM email tracking feature. By adding UTM parameters to your email links, you can easily source the origin of your website traffic and understand how effective your emails are.
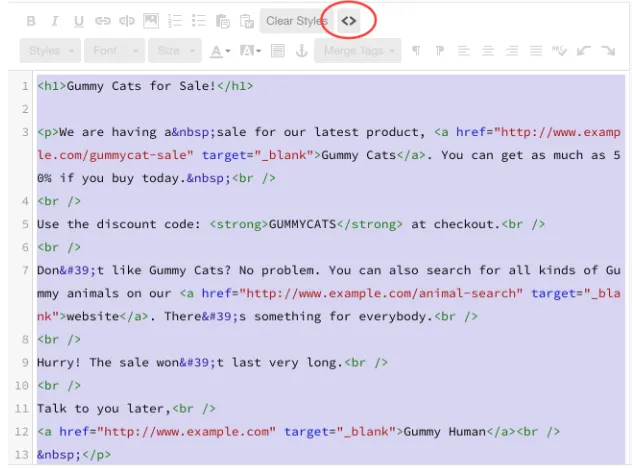
To track your email benchmarks using Terminus, compose your email as usual. You can do that in your email service provider, like Mailchimp. Then, find the HTML source code. With Mailchimp, you’ll get it by clicking on the “< >” button. Other email providers will have something similar.
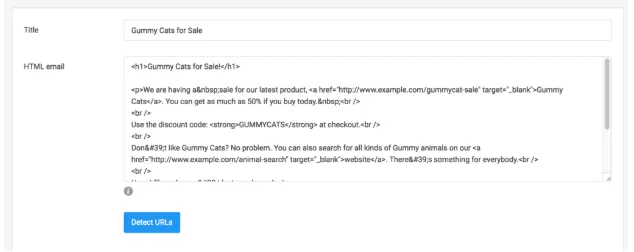
Once you’ve obtained the source code, you can open Terminus and find the “Emails” tab in your project navigation. Click on “track a new email,” and then copy and paste the HTML code into the field provided.
Terminus will automatically identify valid URLs in your HTML email once you plug it into the email builder. You can also choose to use shortened URLs to track email clicks in Terminus. From there, click on “Build tracking URLs and Email.” You’ll then receive reports on email opens and clicks on tagged links.
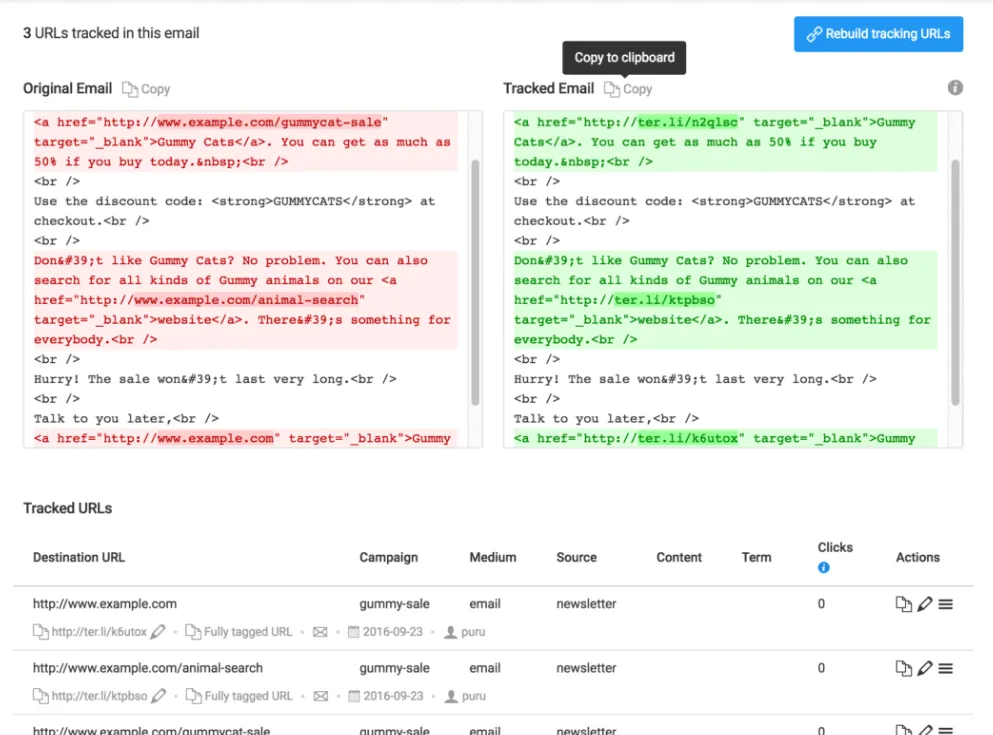
creating UTM codes with TerminusApp
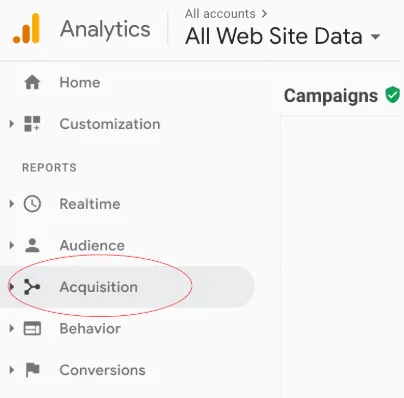
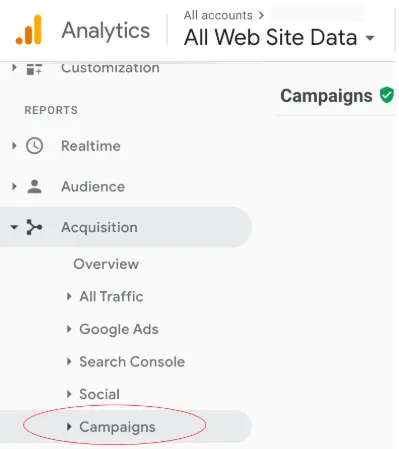
You will also be able to find your email link click reports in Google Analytics.
To find them, open your account and navigate to Acquisition > Campaigns > All Campaigns.
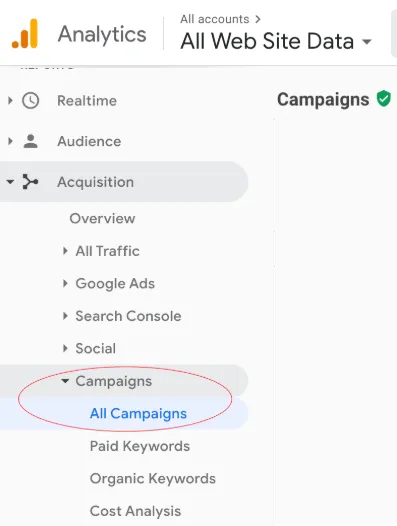
From here, you’ll see your reports broken down by campaign name. Using this method will also help you track these clicks all the way and see if people converted on your website.
Conclusion
Tracking email benchmarks is an important tactic for all email marketers. Understanding how your emails stack up against your industry average will allow you to adjust and strengthen your campaign strategy for the long term. Best of all, Terminus’ email tracker makes doing that easy. If you haven’t already, try your zero-risk, 21-day Terminus App trial today.
- 3 Users
- 5 Projects
- 2 Custom Domains
- Simple Taxonomy
- UTM Rules
- Presets
- Labels
- Notes
- Custom Parameters
- Multi-tag UTM Builder
- Auto-shortening
- Click Reports
- Fine-grained User Permissions
- Auditing Tools
- Chrome Extension
- Custom Domain SSL
- URL Monitoring
- Redirect Codes / Link Retargeting
- Bulk Operations
- 5 Users
- 10 Projects
- 3 Custom Domains
- All Taxonomy Types
- Bulk URL Cloning
- QR Codes
- Conventions
- Grid Mode URL Builder
- Email Builder
- Auto-generated Tracking IDs
- Automated Exports
- API Access
- Custom Users
- Custom Projects
- Custom Domains
- Single Sign-On (SSO)
- Invoice Billing
- Signed Agreement
- SOC 2 Type 2